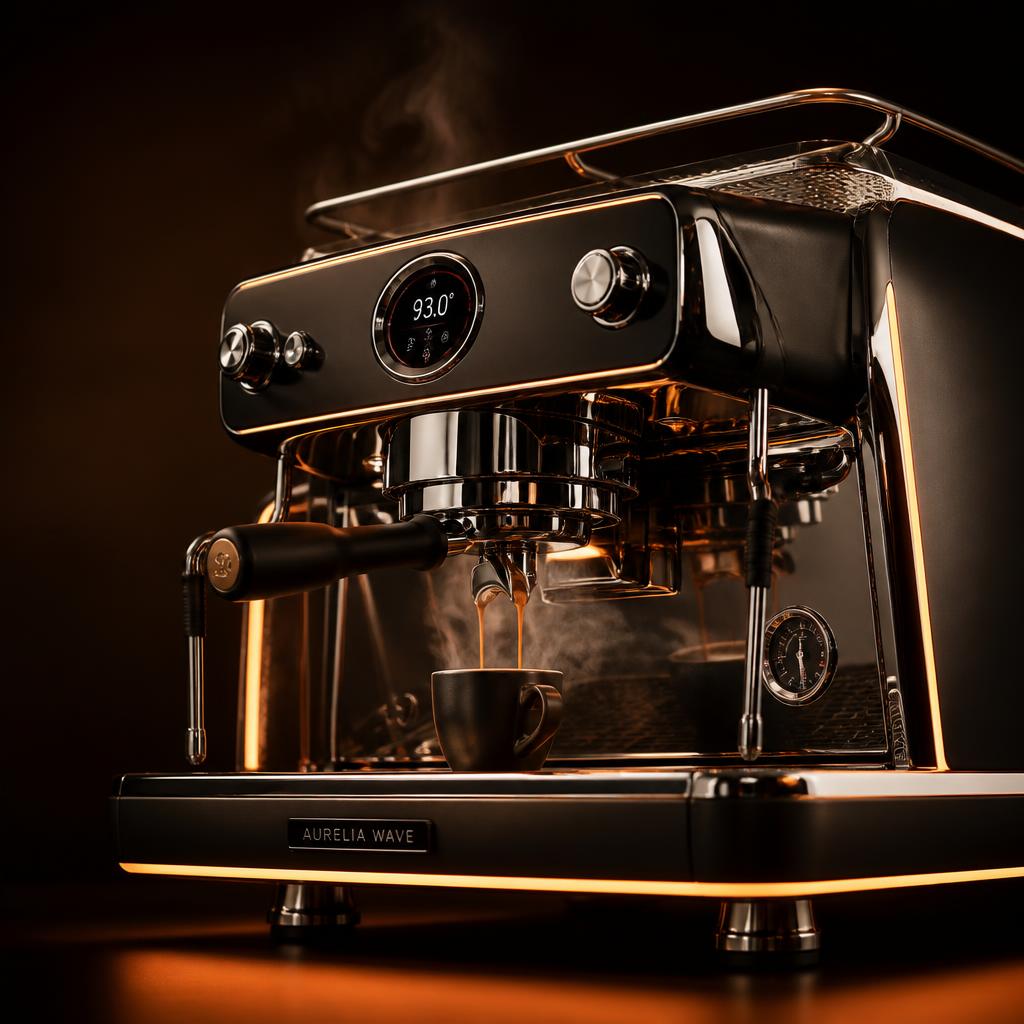

Premium commercial espresso machine pulling a shot
Priced by what a cup truly costs

Roast & Co · Café equipment economics · Baku, Azerbaijan

Bought once. Felt in every cup.

I help cafés choose coffee equipment the way engineers buy power plants — by total cost of ownership, not sticker price — and build the websites that bring the customers in. Every recommendation reduces to one honest number: what a cup actually costs to pour.

$5,000+
earned building café websites
up to$15,000
award won for the Roast & Co concept
21
coffeeshops across Azerbaijan
01

Roast & Co

What does a cup really cost?

Describe your bar and Roast & Co ranks the machines by what they would truly cost you — money and carbon, per cup. Free to use; sign in once so this nonprofit can count who it helps.

Preview with example numbers — sign in to run your own. Free; this nonprofit only counts usage.
AI machine advisor

Tell us how your café works.

Describe everything that matters. The advisor reads every preference and recommends real machines from the catalogue.

Daily cupsBudgetBarista setupCounter spaceDrink menuYour priorities
150
20600
$12,000
$1,000$20,000
Operation preference
60%
0%100%
Currency

Machine prices are researched market estimates; the barista wage is a placeholder — set the real Baku figure. I run this analysis with your actual quotes and wages.

Machines you can actually buy in Baku

Prices are the suppliers' listed prices; ownership costs use editable class assumptions marked in the source. Links open the supplier's page — purchase happens there.

02

How the method works

Sticker price is a down payment.

Total cost of ownership is the whole bill — everything a machine will take from you over its life, counted before you sign. The full model stays in-house; here is what it does for you.

01

Every cost, counted

A machine's price tag is the smallest of its bills. Roast & Co weighs the ones that arrive later — service, staffing, electricity — across the years you'll actually own it.

02

One honest number

Every option collapses to a single comparable figure for your bar, in money and in carbon. Machines that look far apart on price often trade places here.

03

Decisions, not opinions

The tool doesn't argue taste. It shows which machine your volumes would choose, flags what doesn't fit your budget, and lets your preference break the ties — with the working kept in-house.

Energy analysts call this levelized cost. Cafés should steal it.

03

Case studies

Real bars, real invoices.

One decision, shown in full: the situation, the trap, the arithmetic, the outcome, and where the analysis stops being true.

Case study 01 · Equipment analysis + website

O to go — around 30 convenience stores with a coffee counter, Baku

O to go runs roughly 30 convenience stores across Baku, each with counter coffee sold alongside the till. High footfall, short queues, no dedicated coffee staff — coffee is an attachment sale, and the margin on it has to survive the labour it costs.

Client
O to go · ~30 stores, Baku
Machine chosen
Franke A400
Saving projected to December
≈ $300,000
Volume modelled
250–300 cups/day per store
Payback on the machine
≈ 13 months

01

The situation

When counter coffee was introduced across the stores, an entry-level Dr. Coffee bean-to-cup machine was installed specifically to avoid the cost of staffing a coffee counter. At real trading volume the cup was weak and inconsistent, the machine stalled under load, and customers noticed. The internal conclusion was that automation had failed, and the business began pricing traditional barista espresso machines and the staff required to operate them.

02

The trap: both obvious answers were wrong

The machine on the counter was rated for roughly 30 cups a day. The counters were pulling 250–300 — close to eight times its rated duty. That is not a failure of automation; it is a tiering error, a home-class machine placed on commercial duty. No equipment survives that. Meanwhile the barista line looked like the quality answer only because nobody had priced a barista's wages across three years.

  • Duty rating — the cheapest machine is the one specified above your real volume, not below it.
  • Labour — a loaded barista costs about AZN 700 a month per store. Across 30 stores that compounds every single month; a machine is paid for once.
  • Downtime — a stalled machine at 8am is a lost sale plus a customer who buys coffee elsewhere tomorrow.
  • Consistency — a super-automatic closes a control loop on brew pressure, water temperature, extraction time and dose. A human holds those variables loosely.
  • The floor, not the ceiling — for a convenience brand the value is not the best cup possible, it is that every customer receives the same cup.

03

The analysis

The cost model was anchored to Azerbaijani operating data rather than imported assumptions — loaded barista cost, the current business electricity tariff, and the prevailing exchange rate — and run across three store formats. Below is the medium format: 300 cups a day. Figures marked client came from O to go's own payroll and trading data; est. figures are researched market estimates and were labelled as estimates to the client too.

Annual running cost per store at 300 cups a day: Dr. Coffee, barista line, Franke A400
Line Dr. Coffee
incumbent
Barista line
machine + staff
Franke A400
chosen
Rated duty ~30 cups/day spec Limited by staffing, not machine Commercial, 300+ cups/day spec
Actual demand 250–300 cups/day client 250–300 cups/day client 250–300 cups/day client
Dedicated staff None — counter staff 1 barista, ~AZN 700/mo loaded client None — counter staff
Annual running cost Stalling under load; unserviceable at this duty ≈ $20,000/yr est. ≈ $3,900/yr est.
Annual difference — + ≈ $16,100/yr, almost entirely labour baseline
Labour cost per cup — materially higher ≈ $0.14 on a cup sold at ≈ $2.20

The arithmetic, in words. Take the purchase price. Add maintenance for every year the machine is expected to run. Add the labour it demands each day, multiplied by the days it runs. That is the total cost of owning it. Divide by the number of cups it will pour over the same period, and you have cost per cup — the only figure on which different setups can honestly be compared. On that basis the Franke A400 repays its purchase price in about 13 months, and across a ten-store network the five-year difference approaches $0.8 million.

04

The decision: what it is worth to the business

O to go selected the Franke A400. The argument that carried it was not taste, it was unit economics: the same cup, every time, at a labour cost of roughly 6% of its selling price, with no headcount added to any store.

$16.1ksaved per store, per year, against the barista line
≈ $300kprojected saving to December across the network
13 mopayback on the machine's purchase price
$0.14labour in a cup sold at ≈ $2.20
0new hires required across ~30 stores
10×duty headroom vs. the machine it replaced
How the process actually works
  1. 1Measure

    Count real cups per day per store format. One number, two weeks, no guesswork.

  2. 2Price the labour

    Loaded wage, local tariff, local exchange rate — not imported benchmarks.

  3. 3Model the options

    Every candidate machine priced over its life, per store format.

  4. 4Match, don't blanket

    Each format gets the machine its volume justifies — a rule, not one answer.

  5. 5Install and verify

    Purchase, install, then re-check cups and cost per cup against the model.

Total client time in the process: a handful of meetings and one data export. The analysis was done on this side.

“What we had experienced was not a failure of automation but a tiering error: a home-class machine placed on commercial duty. He argued against his own recommendation where the evidence required it. That is not always our experience with people selling us equipment.”

Aynur Qaraqurbanlı · Head of Marketing, OBA Market MMC (O To Go), Baku

05

What I'd do differently — and where this analysis stops

This result held for this business, at this volume, with this staffing. A specialty roastery or a premium city-centre café, where craft is itself the product, should reach the opposite conclusion — and I said so to the client in writing.

  • It priced cost, not the revenue difference between a good cup and a great one.
  • It assumed steady volume, with no new store format and no seasonal collapse.
  • Water, filtration consumables and waste disposal were treated as roughly equal across options — defensible here, not universally.
  • Resale value at end of life was ignored, which quietly flatters the cheaper machine.
  • Next time I would measure cups per day for two full weeks per format before modelling, rather than accepting an estimate.

06

The method, generalised

  1. List every cost over the asset's life — purchase, install, maintenance, parts, downtime, disposal. Not the invoice; the whole life.
  2. Price the labour — minutes per day × wage × days. This is usually the largest number and almost always the missing one.
  3. Divide by output — total cost ÷ cups over the same period.
  4. Compare per unit, not per invoice — the cheapest purchase and the cheapest cup are rarely the same machine.
04

A study with a tool attached

What's Still in the Bin

Spent coffee grounds are the heaviest thing a café throws away — and the only thing in the bin a farmer would want.

Spent grounds are the heaviest, wettest thing a café throws away — and the only thing in the bin a grower would drive across town for. Nitrogen, phosphorus, potassium, and a fine texture that holds water in soil that does not.

In Baku there is no route between the café that discards them and the grower who could use them. That missing link is the whole point of this section.

The only number that matters

Cups in, compost out

—used espresso bags a month
—kg of grounds a month
—kg of finished compost a year
—m² of soil it can feed

36 g of wet grounds per cup, and cafés hand them over in their own empty 1 kg espresso bean bags — about 1.5 kg of wet grounds per bag. Finished compost is roughly half the grounds' mass after water loss, applied at 5 kg/m². Estimates, not measurements.

Drag the story

One waste stream. Two endings.

1 / 4
ONE AVERAGE CAFÉ
60 kgof spent grounds every weekCITY OF SYDNEY STUDY ↗
The bin fills faster than it looks.

Measured across cafés in a six-month City of Sydney study. This is spent coffee alone—not cups, food or packaging.

ONE YEAR · ONE CAFÉ
3.1 tof grounds can reach the waste streamSTUDY + CALCULATION ↗
One weekly pile becomes tonnes.

Calculated as 60 kg × 52 weeks. It is a transparent benchmark—not a measured result for every café.

21 CAFÉS · ONE YEAR
65.5 tof grounds at network scaleSTUDY + CALCULATION ↗
A small network creates a large stream.

Calculated from the same measured benchmark: 60 kg × 52 weeks × 21 cafés. It shows scale, not a claimed Azerbaijan measurement.

THE WILLINGNESS IS THERE
77%of cafés wanted to participateCITY OF SYDNEY STUDY ↗
The missing piece is connection.

In the same study, more than three in four cafés said they would join a grounds-recycling program.

The café only separates it. The grower takes it, composts it safely, and turns a disposal problem into a soil input.

Who is already doing this

Kilograms are an estimate based on self-reported cup volumes, not a measurement.

Something to put on your counter

Roast & Co

The grounds from your coffee go to .

Spent coffee grounds become compost for growing near here.

Fakhri Ibrahimov Founder · Baku, Azerbaijan ibrahimovfakhri99@gmail.com

Two sides, one list

The registry

Pick your side, fill six fields, done. Nothing appears publicly unless you tick the box.

We collect only what these forms ask for — name, city, phone, email and capacity — and use it solely to connect cafés with growers. Nothing is shown publicly unless you tick the consent box. To be removed, email ibrahimovfakhri99@gmail.com; deletion requests are honoured.

Not ready to register? ·

Honest limits

One café is not enough. Roughly 2.6 tonnes a year at 200 cups a day is a rounding error to any composting operation. This works at aggregation, not individually — the same constraint that applies to every use of this material.

Weight is mostly water. Grounds are 60–80% water, so collection is largely transporting water. Collection radius is the binding economic variable.

Manure is the real competitor. Azerbaijani growers already have cheap, well-understood organic inputs. Grounds compete against a low-cost incumbent, not against nothing.

What happens to Baku's waste today. Balakhani operates a sorting plant and an incineration plant with capacity for 500,000 tonnes of household waste a year. Mixed municipal waste here is largely incinerated. The argument is not landfill methane: burning material that is mostly water is a poor use of it, and combustion destroys nitrogen and organic matter that soil in this region needs.

Grounds-per-cup, compost yield and application rates are estimates and marked as such. Agronomic claims are drawn from published research. This section models an idea and hosts an open registry; it does not describe a collection service currently operating.

05

About

The founder

Roast & Co is built by Fakhri Ibrahimov, a 16-year-old from Azerbaijan with an Olympiad and STEM background — [EDIT: add specifics, e.g., subjects, medals, competitions].

It started with websites: $5,000 earned building them for coffee shops before finishing school. Then OtoGo — a convenience-store company in Baku — needed help with its website and a machine decision, and the same mistake showed up close: equipment bought on sticker price, paid for every month after. Roast & Co is the fix: run the numbers first, buy second.

The concept won an award of up to $15,000, and the method now points beyond coffee — the same cost-per-unit discipline, from café bars to power grids.